
With thin liquidity ahead of tomorrow’s holiday in several European countries, dollar ended the day mixed across the board, this last day of April. Gbp and Canadian dollar advance against dollar, printing the most interesting winnings of the day, while Euro and Swiss Franc corrected from early European highs, yet spent most of the American session consolidating ending the day negative. Wall Street rallied following previous sessions stocks, despite Chrysler filed for bankruptcy protection in a plan that would provide new ownership for the ailing auto maker.
Japanese yen continued loosing reaching against dollar the 99.00 level, yet ended the session around 98.60, above the key 98.45 level. Unwind of safe haven position and rising risk appetite, will probably continue pushing the pair up.

Eur Over Dollar, Good Risk/Reward
Eur/$ continues to chop in tighter and tighter ranges since the Oct low at 1.2335, supported by the bullish trendline since that low (currently at 1.2525), and capped by the bearish trendline from Dec (currently at 1.3330). Note that the market has reversed lower after the earlier spike above that resistance (also a 50% retracement from the March 19th high at 1.3735), potentially forming a bearish “false break”, and raising potential for declines back to the Apr 22nd low at 1.2890 and even the base of the pattern ahead (see “ideal” scenario in red on daily chart below). Looks like a good risk/reward short area here (currently at 1.3260), as a close above that bearish trendline (currently at 1.3330/45) would abort this negative view, and be a sign to stop (limited risk). Note too that such a close above there could trigger a further upside acceleration, so would also reverse to the long side on such a move. Resistance above there is seen at 1.3405/15, while support before 1.2890 is seen at 1.3135/45. Note, stopped on the Apr 21st short at 1.2980 on last week's break above the bear trendline from early April (then at 1.3110, closed at 1.3140).
Longer term no change, as the view that has been in place over the last few months of an extended period of wide ranging, remains in place. At this point, may be forming a large pennant/triangle, generally seen as a continuation pattern, and raising scope for a downside resolution. However, most other currency pairs appear to be pointing to a downside resolution of the $ (upside for eur/$), greatly lowering the confidence in the triangle/pennant view. Note too that a close above the ceiling (currently at 1.3330/45) would abort, and greatly increase the likelihood for gains all the way back to the Dec high at 1.4715 and even temporarily above. Switched the longer term bias to the bearish side in the Apr 21st email, but will want to reverse it to the long side on a close above the ceiling/bearish trendline from Dec.


Longer term no change, as the view that has been in place over the last few months of an extended period of wide ranging, remains in place. At this point, may be forming a large pennant/triangle, generally seen as a continuation pattern, and raising scope for a downside resolution. However, most other currency pairs appear to be pointing to a downside resolution of the $ (upside for eur/$), greatly lowering the confidence in the triangle/pennant view. Note too that a close above the ceiling (currently at 1.3330/45) would abort, and greatly increase the likelihood for gains all the way back to the Dec high at 1.4715 and even temporarily above. Switched the longer term bias to the bearish side in the Apr 21st email, but will want to reverse it to the long side on a close above the ceiling/bearish trendline from Dec.
Sterling closing at 1.4780
The Sterling (GBP) was able to overextend gains on the back of GFK consumer confidence jumping to -27 vs. -29 previously. Nationwide HPI was at -0.4% vs. -1.2% previously.
“Overall the GBP/USD traded with a low of 1.4705 and a high of 1.4946 before closing the day at 1.4780 in the New York session.”
Forex: EUR/USD holds above 1.3200; Rally against yen eases
On the day that Chrysler bankruptcy was announced markets in the US are mix. Dow Jones now is wining five points but earlier in the session was up more than a hundred points. Dollar suffered some depreciation after the opening bell in Wall Street across the board but gained to Japanese yen.
EUR/USD holds above 1.3200
Euro rose during the American session recovering from intra-day low at 1.3190. The par now is being traded at 1.3255 only 0.01% above opening price of today. Next resistance level is located at 1.3275.
USD/JPY rally eases
Dollar failed to test above 98.90 and went down to the support at 98.50. Since Wednesday the pair has been moving in a up trend after bottoming at 95.61 (lowest since March 23) on Tuesday. Also European currencies have eased the rally against the yen in the last hours.
USD/JPY: Dollar dropped to 97.15 low pares previous gains
The Dollar has given away during Asian session, most of the ground taken after the release of the FOMC statement; from 97.98 high reached during U.S. session, the Dollar has dropped during Asian session to 97.15 low, to trade around 97.40 at the time of writing.
On a longer perspective, the Dollar continues trading upwards from 28 April low at 95.60. Resistance levels for the Dollar lie at 98.00 intra-day high, and above here, 98.15/20 and 98.45 (Apr 23 high). On the downside, support levels lie at 97.15, and below there, 96.60 and 96.20.
EUR/JPY recovery from 128.35 Apr 28 low, has entered in a range from 129.00 to 130.10 during Thursday’s Asian session. Resistance levels lie at 130.10 and 130.95. Support levels are 129.00 and 128.00.
Forex: GBP/USD: The Pound rises above 1.4800
The Pound has broken resistance level at 1.4810 during Thursday’s Asian session, and recovery from Tuesday low at 1.45145 has reached to 1.4850 high.
At the moment the Pound trades around 1.4835 with resistance level at 1.4850 on sight, in case of climbing above here, next resistance comes at 1.4944 and 1.5000. On the downside immediate support lies at 1.4810 and below here, 1.4737 and 1.4675/90.
GBP/JPY recovery from 139.00 low on Tuesday has reached an intra-week high at 144.90 during Thursday’s Asian session although the Pound eased somewhat afterwards to trade around 144.40 at the time of writing. Resistance levels lie at 144.90 and 145.20. Support levels stand at 143.85 and 143.00.
Asian markets rise; Dollar edges down against Pound and Yen
Asian markets have risen on Thursday buoyed by Japanese production and U.S. consumer spending. The Dollar has reversed gains posted after FOMC statement against Pound and Yen, Euro remains in range.
The MSCI Asian Pacific has climbed 3.3% to end the month of April with a 12% increase, the best performance since 1998. Tokyo Nikkei Index rose 3.9% and Hong Kong’s Hang Seng Index added 2.3%.
Japanese industrial production has posted a 1.8% increase in march, after a 9.4% decline in February, while U.S Gross Domestic Purchases Price Index rose 2.9% in the 1Q, following a 0.5% increase in the previous quarter.
Pound and Yen slightly higher
GBP/USD has risen during Asian session to a maximum level at 1..4855, from 1.4750 level reached after the FOMC statement. At the moment, the Pound trades at 1.4840, 0.57% above its opening price.
USD/JPY has dropped to 97.15 low on Asian session, reversing most of the ground taken after the FOMC statement, which fuelled the Dollar to 98.00. At the moment the USD/JPY moves at 97.35; 0.30% below its opening price.
EUR/USD has been moving up and down around the 1.3300 level, after having declined to 1.3250 after the FOMC; At the moment, the Euro trades at 1.3305; 0.40% above its opening level.
BoJ keeps rate unchaned at 0.10%
On their meeting at Tuesday, Bank of Japan policy board voted to keep interest rates unchanged at ultra-low levels as the central bank takes time to gauge the effectiveness of its previous measures.
The BOJ board voted unanimously to keep its unsecured overnight call loan rate unchanged at 0.10%. The board last lowered the policy interest rate in December, by 20 basis points. Earlier this week, the Japanese government also lowered its economic outlook to a record 3.3% fall for fiscal 2009.
The BOJ board voted unanimously to keep its unsecured overnight call loan rate unchanged at 0.10%. The board last lowered the policy interest rate in December, by 20 basis points. Earlier this week, the Japanese government also lowered its economic outlook to a record 3.3% fall for fiscal 2009.
Sterling closing at 1.4750
The Sterling (GBP) tracked the EURO higher with the GBP/JPY especially buoyant. EUR/GBP remained in a tight range which underpinned the relationship of the majors.
"Overall the GBP/USD traded with a low of 1.4635 and a high of 1.4812 before closing the day at 1.4750 in the New York session,"
"Overall the GBP/USD traded with a low of 1.4635 and a high of 1.4812 before closing the day at 1.4750 in the New York session,"
Euro continue to rise
The Euro (EUR) continued to rise rapidly as sentiment improved and Eurozone confidence improved. Of concern was German GDP Growth was downgraded to -6.0% vs. -2.25% initially. The pair rallied to above 1.3300 before easing into the US close.
“Overall the EUR/USD traded with a low of 1.3122 and a high of 1.3340 before closing at 1.3260,”
“Overall the EUR/USD traded with a low of 1.3122 and a high of 1.3340 before closing at 1.3260,”
China’s Gold Holdings Surge 76% over Six Years
Based on the title, you’re probably groaning: ‘Wait, I thought this was supposed to be a forex blog?” Bear with me, however, as this subject is extremely pertinent to forex.
Last week, it was revealed that China has been clandestinely adding to its gold reserves since 2003, to the extent that its holdings increased by 76%, to approximately 1,050 tons. The news initially sent a ripple through forex and commodities markets, which were overwhelmed by the figures involved. After analysts had a chance to gather some perspective, however, the markets relaxed. You see, although the increase seems tremendous in size, it is quite small in relative terms.
It is relatively small compared to other countries: “This places China fifth in the world, ahead of Switzerland’s 1040 tons but behind the U.S. ranked first with 8,133 tons, followed by Germany (3,412 tons), France (2,508 tons) and Italy (2,451 tons).”
It is relatively small given the six-year duration of accumulation: “I think as soon as people realized it’s not a year-on-year increase, or a quarter-on-quarter increase, people realized it should not have that big an impact.”
It is small relative to China’s mammoth $2 Trillion forex reserves: “As a proportion of foreign exchange reserves, which have risen five-fold over the same period, gold now stands at a tiny 1.6 percent, versus 1.7 percent in 2003.”
On some level, the development has at least some symbolic importance, as it demonstrates that it cannot be taken for granted that China will simply continue to plow its (dwindling) trade surplus into Dollar-denominated securities, or even currencies in general. This is underscored by the suspicious timing of the announcement; China essentially waited six years before revealing its buildup in gold, probably in order to coincide with the uproar surrounding the Dollar’s role as global reserve currency. In other words, even though China’s gold purchases in and of themselves don’t amount to much, the Central Bank of China is trying to send a message that it will defend itself against “the depreciation risk of some foreign currencies.”
The announcement also explains the recent buoyancy of gold prices. Historically, there existed an inverse correlation between gold and the Dollar. This correlation has all but broken down as a result of the credit crisis, and for the first time a strong Dollar has been accompanied by high gold prices. Part of the reason may be increased buying activity by Central Banks, including the Bank of China: “The physical market remained well-bid by an unknown buyer despite bullion prices spiking to levels that normally cooled demand…Purchases were made in Shanghai, traders said, in an effort to absorb domestic production and lessen the impact of bullion prices on global markets.”
Pick Your Poison: Inflation, Deflation, Stagflation
Tuesday, April 28, 2009
Analysts see possible scenarios for each of these to strike the U.S. economy. Stay alert and invest accordingly.
Will the real 'flation please stand up?
Experts are arguing about where the U.S. economy is heading as the global financial system tries to right itself. Is it on the path to inflation, deflation, or, worse, stagflation? Rising unemployment and excess production capacity are making it hard for the U.S. economy to climb out of recession. And that, in turn, is putting a strain on pricing power and wage growth—raising fears of deflation, which develops when a broad decline in prices amid falling demand feeds further price-cutting.
But what happens if the Federal Reserve's efforts to jump-start the economy take effect? Stimulus to the tune of $787 billion is supposed to rev up economic engines. Prices could climb too high as too much money chases after available goods and services—the classic formula for inflation.
"I describe [the potential dangers in] this economy in the form of a snowy Minnesota road," says Peter Rekstad, a financial adviser at TruNorth in Oakdale, Minn. "A car slid off the road into the deflation ditch. The way out of the ditch is to get a bunch of friends pushing while you rock the car back and forth. The big danger is that you get out of the deflation ditch and race across the road into the inflation ditch."
Or to take Rekstad's analogy further, say a car is straddling the road, with its wheels mired in both ditches at once—the worst of both worlds. That situation, where growth slows while inflation soars, is known as stagflation.
Here's an investor's guide to protecting your portfolio from these three forces.
Deflation
Deflation is the threat dominating headlines. "You've got a strong supply of goods and weak demand. That's a recipe for prolonged deflation," says A. Gary Shilling, economist and author of Deflation: How to Survive & Thrive in the Coming Wave of Deflation (McGraw-Hill). The problem is deflation's ripple effect: When banks stop lending, businesses stop expanding and wages fall. Consumers stop spending, which pushes prices lower. Why won't massive stimulus pull the economy out of the deflationary lane? Shilling fears that the U.S. government's economic tampering will have a "Big Brother effect," hurting innovation and permanently curbing growth.
The Signs. The surest sign of deflation is a decline in the consumer price index, which tracks the prices of consumer goods and services. But it's hard to ignore lower real estate values, which aren't in the CPI. Home prices fell more than 18% in 2008, according to the S&P/Case-Schiller U.S. National Home Price Index. Another deflation indicator: the higher savings rate, which we're seeing for the first time in 25 years. Shilling expects the savings rate to rise from 4.2% to 10% in the next decade.
Investment Strategy. "Quality is paramount in deflationary markets," Shilling says. He thinks most investors should be in short-term certificates of deposit or money-market funds. Those with a 10-year time horizon should also buy tech stocks, such as semiconductors, he says. Companies facing deflation can't cut prices and must boost productivity through technology.
Inflation
The Argument. Many of the economists and financial advisers polled by BusinessWeek for this story believe the huge amount of money being pumped into banks by the Federal Reserve (chart, right) makes inflation a real threat. Hans Olsen, chief investment officer for JPMorgan Chase (JPM)'s private wealth management business, says the stimulus plan ultimately will lead to higher inflation. However, total inflation is basically nonexistent at -0.4%. The trick is figuring out when it will be a problem. "The nasty thing about inflation is that it's insidious," Olsen says. Banishing inflation from the economy once it is "infected" is hard.
The Signs. The leading indicator used to measure inflation is the CPI.
Commodity prices, particularly those of oil and copper, are another bellwether. One indicator Olsen tracks is government debt as a percentage of gross domestic product, which he sees surging from 40% to 80% over the next few years.
Investment Strategy. Mild price inflation is considered healthy for stock investors because it is a sign that the economy is growing. But when inflation spikes, as it did when it hit 13% in the 1970s, interest rates rise and borrowing stops. For bondholders, soaring inflation eats away at asset values over extended periods.
The most direct way to fight this is to buy Treasury Inflation-Protected Securities (TIPS)—government-backed bonds pegged to inflation via the CPI. (TIPS belong in tax-deferred accounts because they are not tax-efficient.) A study by economic consultancy Peter L. Bernstein Inc. found that, for an aggressive investor who is worried about inflation, a 47%/53% proportion of TIPs to stocks (the study tracked broad stock market indexes) provided the best risk-adjusted real returns over a wide range of inflationary environments.
Among mutual funds, advisers favor the Vanguard Inflation-Protected Securities Fund (VIPSX), which had an annualized return of 5% for the past three years. Other plays include the iShares Barclays TIPS Bond exchange-traded fund (TIP) and Pimco Real Return Fund (PRTNX).
Commodities are another classic hedge. A well-diversified commodity play is the Pimco Commodity Real Return Fund (CRIX), which combines commodities with TIPS. Many advisers also like the SPDR Gold Trust ETF (GLD) and the First Eagle Gold Fund.
Stagflation
Stagflation is caused by the combination of slow growth and surging inflation. Slower growth will come from extreme caution by lenders, households, and businesses, while a shortage of production capacity will create inflationary bottlenecks, argues Mohamed El-Erian, chief executive officer at Pimco. "Stagflation will be part of the new normal," he says.
The Signs. The misery index, which combines the unemployment and inflation rates, is the best gauge of stagflation. In March it was at 8.1%. El-Erian predicts that unemployment will hit 10% by yearend, and 2% inflation could bring the misery index up to 12% by the end of 2010.
Investment Strategy. Insulating your portfolio from stagflation is tough. Equity investors need to take a very conservative stance, focusing on high-quality growth stocks such as Johnson & Johnson (JNJ) and PepsiCo (PEP), says John Boland, financial adviser at Maple Capital Management. Gold, as well as TIPS, will help mitigate some of the inflation risk. El-Erian considers TIPS a bargain because 10-year TIPS are pricing in inflation of less than 1.5% for the next decade, and he sees inflation jumping as high as 6% by 2011.
A-Hunting We Will Go
What income-focused investors should know as they search for higher yield
Yields on most savings and money-market accounts have dropped so low that investors who hunkered down in cash as the financial crisis deepened are now scrounging for better returns. But they still need to tread warily as they reach for higher yield.
Last year, many investors learned the hard way that they can't necessarily bank on what mutual-fund managers call cash -- unless it really is cold, hard currency, preferably insured by the FDIC.
They saw one of the oldest money-market mutual funds "break the buck," meaning its net asset value fell below $1, after the Reserve Primary Fund's holdings of presumably high-quality but suddenly worthless Lehman Bros. securities triggered a wave of institutional redemptions.
Remaining investors who held shares in the Reserve Primary Fund found every dollar they invested was worth a few pennies less. As of mid-April, some were still waiting for their money.
Owners of auction-rate securities, which some brokerages treated as cash, also saw those securities plunge in value after the market for them collapsed.
Brokerages that sold clients these instruments -- including Bank of America Corp., Merrill Lynch Co., Goldman Sachs and Citigroup -- eventually bought back these securities to make investors whole. Several entered multi-billion-dollar settlements with regulators, who accused them of misleading investors. Last week California sued Wells Fargo Co. on similar grounds.
No Free Lunch
After these events, the U.S. instituted some extra safeguards around the segment of investments that savers treat as nearly the next best thing as a mattress. The Treasury Dept. has extended a guarantee of money market mutual fund assets until mid-September.
Still, it's up to individual investors to uncover any hidden pitfalls in investments designed to act very much like cash.
The bottom line, say money managers, is that for every bit of yield, the investor is probably giving up a degree of safety and liquidity.
"There's no free lunch," said Scott Donaldson, senior investment analyst with Vanguard's investment strategy group. "In order to get higher yields, there is higher risk."
It may be a risk that's worth taking if your time horizon is right. Annual yields on the safest money-market funds -- which generally carry higher yields than the FDIC insured "money-market accounts" offered by banks -- have slid to 0.6%, according to iMoneyNet.
Yields are close to zero if you take your money out in a month's time. The compound 30-day yield on retail money-market funds that invest in Treasurys has slid to 0.04%.
The yield picture isn't much prettier if you lock up your savings in a bank certificate of deposit.
A three-month CD has an average yield of about 0.75%, says Bankrate.com. A six-month CD carries a rate of about 1%.
These ultra-low payouts stem from the Federal Reserve's policy of lowering interest rates to near zero and strong investor demand for government-backed investments.
In fact, investors have moved so much of their money out of the stock market that money market funds and certificates of deposit amount to about 60% of the market capitalization of the Wilshire 5000, estimates money manager W.P. Stewart.
Yield Signs
To generate more income, investors have to be willing to let their money sit for longer periods, which means there's more of a chance that something could go wrong. But as you hunt for yield, here are some ways to stay out of trouble:
1. You don't get something for nothing. That's true even when deciding among different varieties of the same investment, such as a money-market fund.
Much higher-than-average yields are actually a red flag, said Paul Reisz, a product manager at bond-fund giant Pimco.
"The yield does actually tell you a story," Reisz said. "What it usually means is that there's some sort of risk taken on and it's usually from the type of instrument being purchased and weighted average maturity of the portfolio."
And keep a close eye on how much of a money-market fund is in floating-rate paper, Reisz added. A high concentration exposes a money fund to interest-rate risk, jeopardizing the manager's ability to keep net asset values at $1.
2. Look for deep pockets. After the Reserve Fund debacle prompted many investors to pull savings from money market funds, threatening to push the net asset value of other funds below $1, Bank of New York Mellon and other big managers bailed out their own money funds.
"You want to go with companies that have been around a long time," said Tom Orecchio, a principal at Modera Wealth Management in Old Tappan, NJ.
Also, pay attention to expense ratios, he said. Expenses for money-market mutual funds can range from 0.2% to 0.7% or more. High fees can depress yields to "next to nothing," he points out.
3. Know your time horizon and risk tolerance. Figure out when you'll want to turn your cash-like investment into real cash that can pay for groceries and mortgage payments.
Many advisers suggest placing three- to six months' worth of living expenses in a bank savings account or other highly liquid account, such as a money-market fund. Despite what happened with the Reserve Fund, only a few of these vehicles have ever not returned investors' principal on demand.
The same can't be said for bond funds. Their net asset value can slide, just like any other mutual fund. But a bond fund's yield might make up for some of that loss.
4. Look at underlying credit quality. Within both money-market funds and short-term bond funds, investors can choose from those that primarily invest in Treasurys; those that invest mostly in debt issued by government-sponsored Fannie Mae, Freddie Mac and Ginnie Mae; and corporate bonds (in money-market parlance, these are called "prime" funds.)
Funds that invest in Treasurys, or direct IOUs from the U.S. government, are considered safest and so carry the lowest yields. Debt issued by the government-sponsored agencies has the implicit backing of the U.S. government.
And corporate debt -- no surprise -- is considered riskiest but carries the greatest potential reward.
Orecchio, of Modera Wealth Management, said he also looks at tax-exempt "prefunded" municipal bonds. It's safer than a typical municipal offering, he said, because the issuer buys U.S. Treasurys as a type of collateral for its obligation.
5. Remember that cash can be trashed. Every yield-producing investment carries some risk, no matter how much a fund manager vows it's just like cash.
Said Reisz: "The perfect representation of cash is the dollar in your wallet."
Laura Mandaro is a reporter for MarketWatch in San Francisco.
Federal Reserve takes fresh stock of economy
WASHINGTON (AP) -- Taking fresh stock of economic and financial conditions, Federal Reserve policymakers are considering whether they need to take additional measures to ease the recession.
Most economists are betting there won't be any major announcements Wednesday at the end of a two-day meeting given the Fed's bold $1.2 trillion move just last month to revive the economy.
Still, analysts aren't ruling anything out as credit and financial stresses persist and a new potential danger has arisen to the economy in the form of the swine flu outbreak.
"Never say never with these guys. But I don't think they have a real reason to increase support at this time," said Michael Feroli, economist at JPMorgan Economics.
Fed Chairman Ben Bernanke and his colleagues are all but certain to leave the targeted range for its key bank lending rate between zero and 0.25 percent.
Economists predict the Fed will hold its key rate at that record-low level well into next year, although some would like to see the Fed provide a more explicit commitment on the front. The Fed has been pledging to hold the rate at super-low levels for "an extended period."
With the Fed's key rate near rock bottom, policymakers will examine the effectiveness of existing programs to help the economy. They also will weigh whether those initiatives need to be changed or expanded, while keeping options open for new relief measures.
The Fed hopes its various efforts will get banks to lend again, lower interest rates and increase Americans' appetites to spend, which would help lift the country out of a recession that began in December 2007.
Some analysts said it's possible -- but not likely -- the Fed would decide to boost its purchases of government debt beyond the $300 billion announced last month. Others said the Fed might make changes to a consumer lending program that's gotten off to a rocky start in order to make it attractive to investors.
Much hope is riding on the program called the Term Asset-Backed Securities Loan Facility, or TALF. It's been hobbled by rule changes, investor worries about financial privacy and fears that participants might become ensnared in an anti-bailout backlash from the public and Congress. Just $1.7 billion in loans was requested for the second round of funding in April -- down from $4.7 billion in March.
Investors use the money to buy newly issued securities backed by auto and student loans, credit cards and other debt. The program will be expanded to include commercial real-estate loans.
On the economic front, the Fed is expected to strike a somewhat less dour note than it did at its mid-March meeting. Policymakers are likely to note some tentative signs that the recession is easing.
Some more hopeful signals emerged Tuesday. The Conference Board's Consumer Confidence Index rose far more than expected in April, jumping over 12 points to 39.2, the highest level since November. And a housing index showed that home prices dropped sharply in February, but for the first time in 25 months the decline was not a record.
The U.S. economy has sunk sharply, although analysts are hopeful the rate of decline is lessening.
In the final three months of 2008, the economy contracted at a 6.3 percent rate -- the worst showing in a quarter-century. Economists predict it probably declined at a 5 percent rate in the first three months of this year. The government will release its initial estimate for first-quarter economic activity Wednesday morning.
Bernanke has said the recession probably would end this year if the government is successful in repairing broken banking and credit systems.
Before the swine flu outbreak, many analysts were predicting the recession would ease further, with the economy shrinking at a rate of 1 to 2.5 percent in the current quarter.
However, analysts warn that any severe outbreak of the swine flu would not only clobber tourism, food and transportation industries, but crimp spending on other things if consumers get spooked. For now, analysts are hopeful that any economic fallout will be limited and short-lived. But much hinges on the scope of the flu infections and how they affect consumer behavior.
Even if the recession ends this year, the jobless rate -- now at a quarter-century high of 8.5 percent -- is expected to keep rising and top 10 percent early next year.
Sterling closing at 1.4675
The Sterling (GBP) found support below 1.46 before rebounding on better than expected economic data. CBI Distributive trades at +3 vs. -40 the first positive reading since last year.
Our Forex Team said: “Overall the GBP/USD traded with a low of 1.4577 and a high of 1.4773 before closing the day at 1.4675 in the New York session.”
Our Forex Team said: “Overall the GBP/USD traded with a low of 1.4577 and a high of 1.4773 before closing the day at 1.4675 in the New York session.”
USD/JPY still eyeing on 97
USD/JPY is still trading eyeing on 97 breaking after bottoming out at 95.7. The Japanese gets use of the unwinding of the carry trades at the times of the risk aversion and mistrust in the holding assets and investing as its very low interest rate levels which reside currently at just .1%.
The pair can get back soon over this level with improving the market sentiment. “By God's will, we wait tomorrow for the Japanese session for the release of Japanese PMI of April which was 33.8 in March and March Industrial Production Preliminary yearly release which is expected to be down by 34.7% after Feb declining by 38.4% and also we wait for the BOJ interest rate decision which is expected to keep the interest rate unchanged too".
The pair can get back soon over this level with improving the market sentiment. “By God's will, we wait tomorrow for the Japanese session for the release of Japanese PMI of April which was 33.8 in March and March Industrial Production Preliminary yearly release which is expected to be down by 34.7% after Feb declining by 38.4% and also we wait for the BOJ interest rate decision which is expected to keep the interest rate unchanged too".
EUR/USD Current price 1.3154
EUR/USD Current price: 1.3154. Despite indicators seem to be exhausted in the hourly, bullish momentum continues in the pair that seems ready to break above yesterdays high at 1.3166 and firs static resistance for the next hour.
20 SMA is also pointing higher, supporting the bias. “Bigger time frames indicators are also turning up, yet far for announcing a more permanent trend".
20 SMA is also pointing higher, supporting the bias. “Bigger time frames indicators are also turning up, yet far for announcing a more permanent trend".
USD down as American data improve
Dollar close the American mostly lower, against European rivals, particularly against Euro and Swiss Franc that extended earlier gains Tuesday, on encouraging U.S. data that boosted risk appetite. However, Wall Street slipped and close barely red, after a choppy session. Richmond Fed's regional manufacturing index improved in April to -9 from a previous reading of -20, while US consumers' confidence of the economy rose to its highest point of the year, 39.2 from a previous also revised to the upside, 26.9.
Earlier today in Europe, executive ECB board member Bini Smaghi cautioned against further aggressive interest-rate cuts in the euro zone,(next meeting is programmed for May 7th), despite other members previous comments, while in the U.S., the FOMC is expected to leave its funds rate unchanged near the zero mark on Wednesday.
Asian session activity could be limited by Japan’s bank holiday.
Modest losses in Wall Street; Dollar fells before FED day
Wall Street ended today with modest losses in the day before FED decision. Dow Jones Industrial Average lost 8 points to end at 8,017. The index lost its gains in the last hour of session. Nasdaq lost 0.33% and S&P500 0.27%. Also the majority of European markets went down today. In the Forex the dollar fall across the board and so did the yen erasing part of early gains.
EUR/USD weakened
EUR/USD ended the American session close to an important support at 1.3160. During the session reached the highest level at 1.3165 and then fell to the support area of 1.3130. Since then it has been moving between this prices. For the day is up almost 1%.
USD/JPY rose at the beginning of the American session reaching a day high at 96.69. After that it fell to actual support zone at 96.30. The pair remains in a trend that favors the yen.
The dollar decline during the entire session against the Swiss Franc stopping at 1.1415. Now the pair is near that zone and still has momentum. From today high at 1.1595 to the area mention before, USD/CHF has fallen more than 170 pips for today.
Forex: GBP/USD holds above 1.4600
Pound weakened against the dollar during the American Session. GBP/USD now is recovering after reaching a session low at 1.4576. The pair has been moving in a small range in the last hours between 1.4590 and 1.4625. For the day is practically unchanged falling 0.07%. At 1.4510 GBP/USD has a key support level tested early today and also on Monday. During the week the pair has been traded in sideways, with no clear direction.
GBP/JPY recovers after new month low
Against the yen the pound rallied today after reaching new month lows at 139.00 during the Asian Session. GBP/JPY has practically recovered all early losses falling now 0.28% for the day. The pair remains with a down trend in four-hour chart.
GBP/JPY recovers after new month low
Against the yen the pound rallied today after reaching new month lows at 139.00 during the Asian Session. GBP/JPY has practically recovered all early losses falling now 0.28% for the day. The pair remains with a down trend in four-hour chart.
Active Investing: Managing Risk
Monday, April 27, 2009
Protect Yourself From Market Loss

There are many investors who don't know what to do to protect themselves in the stock markets. It comes as no surprise: every self-proclaimed guru claims to have the best strategy since sliced bread. What these "gurus" don't provide is details - as least not free of charge.
Fortunately, there are several simple strategies that you can use to protect yourself from downside risk in both bull and bear markets. In this article we will cover sell stops, sell stop limits, buy stops and buy stop limits, as well as tips and techniques you can use to place them effectively in any type of market.
Sell Stops and Buy Stops Cap Losses
One way to protect your downside in the markets is through the use of sell stops and sell stop limit orders. A sell stop order, often referred to as a stop-loss order, is an order to sell a stock once it reaches a certain price. If the stock reaches the stop price, the order is then executed and shares are sold at the market price for the stock. When the order is to sell, the stop is always placed below the stock's market price.
A stop-limit order is an order to sell a stock once a specific price is reached, as long as the price does not fall below the limit specified by the investor. If the stock reaches the stop price, the order is converted to a limit order. The benefit of the limit order is that you have more control over the price at which the sell will be executed.
With both types of orders, if the stock doesn't reach the specified stop price then the order will not be filled.
Putting Stops in Place
The proper use of sell stop and sell stop limits are a key to protecting your investments. These tools keep the decision-making process simple and unemotional – even when the market is in turmoil. They also help prevent you from rethinking when to take profits and when to jump ship on fast-sinking stocks.
While there is no magic number or percentage used to set stop orders, generally there are two common methods used to place them:
1. Place the stop price below the support level. You can identify a support level by looking at a chart and finding the lowest points for the stock and previous points where it stopped dropping. A break below this point would generally mean that there is a possibility the stock could head lower.
2. Place your stop price 5-15% below your purchase price, depending on your level of comfort. This will prevent you from riding the stock all the way down and help you keep your losses manageable. Also, just knowing what your downside is allows you to determine (and prepare for) a worst-case scenario.
In addition, you can adjust your stops upward as the stock moves up by looking at the point where it stopped dropping previously and then setting the sell stop or sell stop limit just below that level.
How to Avoid Being Stopped Out
When a stock falls to the sell stop price that you set and your shares are sold, this is referred to as being "stopped out". So, while sell stop and sell stop limit orders are a good way to keep you on the right side of the markets, there will be times when you can hit the sell stop or sell stop limit just before the stock starts another ascent.
How can you avoid this? As a general rule, you want to avoid placing stops at round numbers such as $36 because many traders place their stop orders at the round numbers. Once the stock hits this round number, it triggers one last round of selling. The key to choosing a more successful stop is to place your order at an odd number with enough room to account for the last potential round of selling.
For example, if many traders have their sell stops in at $34, you should place your sell stop at $34.15 to provide enough room for a round of sell orders to go through without triggering your sell stop and incurring an unnecessary loss for you. While you can't determine exactly where other traders will place their stops, attempting to account for this will help decrease the chances that you will be stopped out on a temporary drop.
For Short Sellers: Buy Stop and Buy Stop Limit Orders
If you are playing the short side of the market, a buy stop order or buy stop limit order can be used to protect your downside if a position moves against you.
Buy stop orders and buy stop limit orders can be used to protect a profit or loss on short sales. A short sale is the act of selling a stock that you don't own with the goal of buying the stock back at a lower price to make a profit. It the stock rises, you buy it back at a higher price to create a loss. A buy stop order is used to limit a loss or protect a profit on a short sale and is entered above the market price. When the stock reaches this price, the trade is executed at the market price.
A buy stop limit order is an order to buy a stock once a particular price is reached, at which point the order converts to a limit order. The buy order will only be executed at the specified limit price or better.
Setting Up Buy Stops and Buy Stop Limits
Like sell stops and sell stop limits, placing buy stops and buy stop limits can be tricky. Fortunately, there are general rules that apply to where they should be placed:
1. You can place them just above the resistance level of a stock. This is the point where a stock has trouble moving higher. This level forms when investors purchase large amounts of the stock just before a decline with the idea to sell it when it hits that point again.
2. You can place them about 10-15% above where you initiated the short sale if the position is volatile. These can also be adjusted downward to protect profits by looking at the highest point the stock reached on the previous rally.
How to Avoid Hitting the Buy Stops or Buy Stop Limits
Like with sell stops, you want to avoid hitting your buy stop and having the position drop off once the short position is covered (you have bought the shares back at a higher price). A lot of the same techniques that you use on sell stops and sell stop limits can also be applied in this instance. These include avoiding round numbers and instead placing buy stops and buy stop limits at odd numbers.
When your stock does hit the buy stop or buy stop limit, you have a couple of options.
1. Watch and see how the stock trades.
2. Go back in and place another buy stop or buy stop limit to protect your downside on the short (this is a bold move).
However, what you choose to do at this stage really depends on your overall level of comfort.
Conclusion
It is clear that by using sell stops, sell stop limits, buy stops and buy stop limits, traders can protect themselves from volatile markets and prevent massive portfolio losses. That said, you should adapt the way you use these tools to your comfort level. If you use them prudently, they should keep you on the right side of the markets.
Don't Believe in Buy and Hold

No wonder that investors' faith in stocks has been shattered, and both institutional and individual investors have been withdrawing. The buy and hold strategy, which was validated by the earlier long, steadily rising market, doesn't work in severe bear markets. Only one of 1,700 diversified U.S. stock funds showed a gain in 2008, and that was a mere 0.4%. The average of these funds dropped 39%, precisely in line with the S&P 500's decline.
The buy and hold devotees say you can't time the market, and if you aren't in all the time, you risk missing much of the gain. A Spanish research firm found that if you removed the 10 best days for the Dow Jones industrial average in the 1900-2008 years, two-thirds of the cumulative gains were lost. But if you missed the 10 worst days, it found, the actual gain on the Dow tripled. These results are in line with our earlier research and reflect the fact that stocks fall a lot faster than they rise.
We eschew the buy and hold strategy because of what's known in classical statistics as the gambler's ruin paradox. The odds may be in your favor in the long run--in this case, your stocks may provide great returns over, say, 10 years. But if you hit a streak of bad luck, your capital may be exhausted before that long run arrives.

Or more likely, a severe bear market will scare you out at the bottom. Many investors bail out then and don't reenter until the next bull market is well advanced. This explains why the returns of mutual fund investors lag well behind the performance of the funds in which they invest. A widespread retreat is what makes a good bottom, as we've noted in many past Insights. All those who can be shaken out are. They've reached the puke point at which they regurgitate their last equities and swear to never ingest any more.
We've never understood the U.S. individual investors' fascination with stocks, almost to the exclusion of all other investment vehicles. Stock backers point to long-run annual gains of about 10% but neglect to note that about half of that came from dividends, which were much bigger parts of the total return in earlier years, although they may be again in the future.
Also, stock indexes are revised over time, dropping weak and fading companies and replacing them with robust and growing firms. So the performance of the Dow or S&P 500 over time is much stronger than the performance of the companies that were in those indexes, say, 30 years ago. This is known as survivor-bias.
Even with this upward bias, stocks way underperformed Treasury bonds in the 1980s and 1990s in what was the longest and strongest stock bull market on record. The superiority of Treasuries has been even more so since then. One reason that few realize this is because they don't know much about bonds, despite the simplicity of Treasury obligations and, so, they ignore them. Furthermore, commissions on stocks are usually much bigger than on Treasuries, so brokers favor them.
Our all-time favorite graph shows the results from investing $100 in a 25-year zero-coupon Treasury bond at its yield high (and price low) in October 1981, and rolling it into another 25-year Treasury annually to maintain that 25-year maturity. On March 31, 2009, that $100 was worth $16,656 with a compound annual return of 20.4%. In contrast, $100 invested in the S&P 500 at its low in July 1982 was worth $1,502 last month for a 10.7% annual return including dividend reinvestment. So Treasuries outperformed stocks by 11.1 times!
Long-time Insight readers know we have been recommending long Treasury bonds since 1981. Back then, we forecast secular and huge declines in inflation and interest rates. So we declared that "we're entering the bond rally of a lifetime." Unfortunately, that rally is over. Our target of 3% yield on 30-year Treasuries, down from 14.7% in 1981, was exceeded at the end of 2008 when the yield fell to 2.6%. Nevertheless, it was a grand finale to "the bond rally of a lifetime." The yield drop from 4.5% at the end of 2007 provided a 37.5% appreciation. Add in the 4.5% interest and the total return was 42% last year.
In the long run, the stock market rises with GDP, after accounting for intermediate trends in profits' share of GDP and P/Es. In the next decade, we foresee much slower growth in GDP than in the 1980s and 1990s and deflation, with profits' share of the pie falling along with declining P/Es. In this secular bear market, stock market average gains will probably be much lower with cyclical bull markets shorter and weaker, while bear markets are more frequent and deeper.
Forex: EUR/USD falls to 1.3000
Dollar gain momentum and is rising across the board. EUR/USD fell more than a hundred pips sharply from 1.3150 to 1.3000 after the pair failed to brake above 1.3155. Next support after 1.3300 is at 1.2970.
The movement followed reports of a 6.0 magnitude earthquake that hit Mexico, near Acapulco. The stocks in the USA turn and now are down. Dow Jones Industrial Average falls 50 points after worries about the swine-flu increased.
The movement followed reports of a 6.0 magnitude earthquake that hit Mexico, near Acapulco. The stocks in the USA turn and now are down. Dow Jones Industrial Average falls 50 points after worries about the swine-flu increased.
Forex: USD/CHF rallies and stays above 1.1550; USD/JPY recovers
he dollar got stronger across the board and rose against the Swiss Franc. After breaking support zone at 1.1500 the pair rally to 1.1600 where it rebounded. Now is holding above 1.1555. For the day the pair has risen 1.60%. Reaching intra-day high at 1.1603.
USD/JPY rose in the last hours after breaking above 96.65 and recovered early losses. But the pair stopped at 96.90. Next resistance level could be found at 97.10. In the last hour the pair has been quiet moving around 96.70. For the day the USD/JPY is down only 0.05%.
USD/JPY rose in the last hours after breaking above 96.65 and recovered early losses. But the pair stopped at 96.90. Next resistance level could be found at 97.10. In the last hour the pair has been quiet moving around 96.70. For the day the USD/JPY is down only 0.05%.
Dollar and yen appreciated after a flu fear session
US stocks end lower today hit by flu fears. Dow Jones fell 51 points to 8,025 points (-0.6%), Nasdaq 15 to 1,679. These fears strengthen US dollar and Japanese yen both gain in the session across the board.
EUR/USD fell 1.71% losing half of last week gains. The pair stopped the downside rally at 1.3000 which now is supporting the euro. GBP/USD also fell but only 0.25%. Cable performed well today appreciating strong against the euro. EUR/GBP lost 1.50% today. The euro was among the worst currencies of the day.
Yen moves in a downtrend against European currencies
GBP/JPY reached today a new month low at 140.12. Now is traded at 141.32 after rebounding from today lows. The pair is moving in a down trend in four-hour chart. At 142.00 the pair has the next resistance.
EUR/JPY fell today more than 1.82% reaching the lowest price since March 13. Today marked the end of a recovery that the pair started last Wednesday and broke below support zone at 126.00 to 125.65.
Euro down on ECB comments
With dollar up on risk aversion, triggered by fears of a pandemic swine flu (with 150 cases in Mexico, 40 in the U.S., and some cases in the U.K, Spain, and New Zealand), Euro was the bigger loser today, falling as far as 1.3000. The hegemonic currency fell also after ECB Council member Ewald Nowotny said euro zone rates will stay low for a long time and the ECB is ready to use quantitative easing measures if needed. Also, ECB President, Jean Claude Trichet, told in New York Monday that lowering interest rates is not necessarily the best way to fight a recession.
“Our actions have been different from those taken by other central banks, reflecting differences in economic and financial structures. Indeed, given the different economic structures, they need to be different to reach the same objective," Trichet said.
Wall Street lost early winnings, and fell 51 points or 0.6%
USD/JPY fell sharply
The USD/JPY fell sharply on surging risk aversion. The Japanese government downgraded Japan’s growth outlook and Larry Summers warned that the US economy will continue to deteriorate with sharp declines in employment for quite some time.
The stock market took Summers’ warning in stride and the Dow fell 51 points to 8,025. After breaking its uptrend last week, the USD/JPY is trading in a downward sloping trading channel
The stock market took Summers’ warning in stride and the Dow fell 51 points to 8,025. After breaking its uptrend last week, the USD/JPY is trading in a downward sloping trading channel
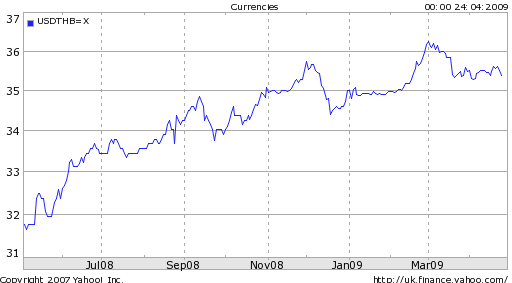
Thai Baht Continues to Slide, but Unaffected by Political Turmoil
The value of the Thai Baht continues to erode, and the currency has now fallen 10% in the last year. It recently touched a two-year low against the Dollar. Weighing primarily on the Baht is the global economic crisis, so it is hardly unique in this regard. “The government has forecast the economy will contract by 3% this year, which would be the first time it has shrunk in more than a decade.”
Thailand’s economy is heavily reliant on exports, a category which also includes tourism. “The tourism council forecast revenue for the industry this year could drop 35 percent to only 350 billion baht in 2008,” and “The commerce ministry announced that Thai exports fell by 23.1 percent in March year-on-year, the fifth consecutive month of decline.” This is certainly the worst economic crisis to hit since the 1997 Southeast Asian economic crisis, but the country is in much stronger shape this time around. ” ‘Both at the national government level and in the private sector, the balance sheets are much stronger.’ ” As a result, Thailand has thus far managed to stave off a run on its currency, even despite a decline in investment- both direct and speculative. The Thai stock market is sagging; according to one commentator, “Fund flows could continue to drag the market down as we see profit-taking in this region.”
The government and the Central Bank are working in tandem to relieve the situation, but there isn’t much optimism surrounding their efforts. The Minister of Finance recently announced an (attempted) expansion of Thailand’s own version of an economic stimulus plan, to $40 Billion. Funding will be provided for “investment projects in a wide range of industries such as logistics, agriculture and energy. The Bank of Thailand recently slashes rates to 1.25%, tying a record low that was set in 2003.
However, “The decision to cut the rate by a quarter percentage point to 1.25 percent came as more than 40,000 protesters seeking to oust the government were massed in the capital Bangkok.” The political unrest in Thailand is old news at this point. It began over a year ago when then-Prime Minister Thaksin Shinawatra was ousted in a military coup. Since then, there have been an unending series of protests and counter-protests aimed at keeping him out or bringing him back. Basically, no one is happy with the current situation, but still there are no signs of political change. The Prime Minister has refused requests to resign, and Thaksin remains in exile outside the country.
The political uncertainty isn’t really weighing on the Baht, but one analyst warns this could change: “The baht is likely to underperform in the near term due to political tensions, which have prevented the government from undertaking aggressive fiscal stimulus.” In other words, while tourism has been impacted by the protests, the biggest problem is that the government is being hamstrung in its efforts to forge a strong response to the economic crisis.
Led by China, Central Banks Seek Alternative to Dollar
Saturday, April 25, 2009
“China is a hostage. China is America’s bank and America basically says there’s nothing you can do to me. If I go down you don’t get paid.”
While the Obama administration has pledged the kind of fiscal responsibility that would secure its government obligations, its actions haven’t been so responsible. The Fed recently announced purchases of $1 Trillion in government debt, while the government is set to rack up Trillion-Dollar deficits over the next decade, even by the most conservative estimates.
In other words, China is in a quandary; stop lending to the US, and you might see the value of your existing reserves plummet. Continue lending, and you risk the same result. Tired of participating in this apparent no-win situation, China is finally taking action.
First, it will petition the G20 at its upcoming meeting for some level of protection on its $1 Trillion+ “investment” in the US. Meanwhile, Zhou XiaoChuan, governor of the Central Bank of China, has authored a paper calling for a decline in the role that individual currencies play in international trade and finance. According to Mr. Zhou, “Most nations concentrate their assets in those reserve currencies [Dollar, Euro, Yen], which exaggerates the size of flows and makes financial systems overall more volatile.” His point is well-taken, since of the $4.5 Trillion in global foreign exchange reserves that can be identified, perhaps 85% are accounted for by Euros and Dollars alone. When crises occur, everyone flocks to these currencies.
Mr. Zhou’s proposal is not without precedent. “His idea is to expand the use of ’special drawing rights,’ or SDRs— a kind of synthetic currency created by the IMF in the 1960s. Its value is determined by a basket of major currencies. Originally, the SDR was intended to serve as a shared currency for international reserves, though that aspect never really got off the ground.” It’s not clear exactly how such a system would work, but the idea is straightforward enough; instead of holding individual currencies, which are inherently volatile, Central Banks would be able to denominate reserves in a sort of universal currency. Instead of parking money in US Treasury securities, they would hold IMF bonds, or some equivalent.
Even before China starting becoming more vocal about its concerns, analysts had begun questioning the role of the US as reserve currency. I’m not just talking about the perennial pessimists. Within the context of the current credit crisis, a bubble may be forming in the market for Treasury bonds. “Foreign buying of American financial assets by both private investors and governments averaged $141 billion from September to December, Treasury data show…Demand was so strong that, for the first time, investors accepted rates below 0 percent on three-month Treasury bills to safeguard their capital.”
There is concern that a slight recovery in risk appetite (of which there is already evidence) could ignite a massive sell-off: “People are sitting there holding massive amounts of zero- yielding dollar assets. If there is any sort of good news, demand for dollars can drop off very, very quickly.”
A Guide to Forex Leverage, and Employing it Safely
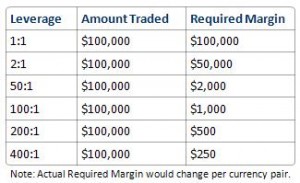
You have probably seen the advertisements - “Trade Forex with 400:1 Leverage” - without being entirely clear as to what exactly these brokers are offering and/or wondering why someone would want to leverage trades to such an extent.
Simply put, forex leverage (also referred to as margin) “is a loan that is provided to an investor by the broker that is handling his or her forex account.” With leverage, you can effectively increase your purchasing power, and buy securities in excess of what you would otherwise be able to afford, with the goal of maximizing relative returns. For example, if you achieve a 25% return on a $2000 trade/investment that was carried out with 2:1 leverage, you actually achieved a 50% return on the $1000 of capital that you personally invested; the other half, by implication, was provided in the form of a loan by the broker. Of course, the inverse also holds, such that a 25% loss would be magnified into a 50% loss, under the same parameters. See the table below for further understand this “multiplier effect.”
 While traders can theoretically use margin to trade any kind of financial instrument/security, leverage is especially common in forex. The reason is that currencies are typically bought and sold in units of 50,000 - 100,000, which is more than retail traders can afford, or are willing to commit. Moreover, currencies are not as volatile (outside of the credit crisis, that is) as other securities, and typically don’t fluctuate more than 1% in a given day. Changes are often so minuscule that 1/10000 of a unit (onePip) has become the benchmark for measuring fluctuations. Accordingly, “currency transactions must be carried out in big amounts, allowing these minute price movements to be translated into decent profits when magnified through the use of leverage.”
Leverage allows traders to put up only a fraction of the capital required to make a given-sized trade ; with 200:1 leverage, for example, $500 would be enough to fund a $100,000 trade. Unfortunately, leverage always favors the broker, much the same way that casinos benefit on average from extending credit to gamblers. According to one especially cynical commentator: “The game basically works this way: The broker is the shark. The retail trader is the shark food. If you want to make money currency trading, give yourself a fair chance and our advice is not to go more than 10x.”
A browsing of forex chat rooms and message boards reveals a surplus of disaster stories involving leverage, such that one can safely conclude that excessive leverage almost invariably leads to excessive losses. This lesson even seems to apply to institutional investors, despite the perception that they have an edge when trading forex, and hence would seem to represent excellent candidates for making leveraged trades. In the context of the current economic quagmire, “Investment banks were trading with 40:1 leverage in some cases. The banking crisis in the US was caused by banks not buying based on solid fundamentals and using insane leverage to buy securities.”
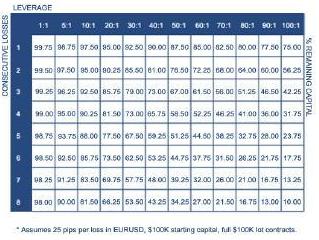
When trading a strategy that is based on technical analysis, “Even though you find one with 80-90% successful system on the paper, when you trade it usually come down 60%. So if we are losing at 40% of the time it is essential that we control risk.” Accordingly, putting more than 3% of your capital at risk on a given trade would seem suicidal. Applying more than 20:1 leverage (which seems trivial compared to 400:1) is very dangerous when you consider that a relatively benign 25 pip decline would result in a 5% loss. You can use the matrix below to calculate a “worst-case” scenario and figure out how much leverage you can get away with in the event that your trading strategy fails on consecutive occasions. It is surely much lower than you expected!
 To give you an idea as to how excessive forex leverage has become, consider that the Financial Industry Regulatory Authority (FINRA) recently submitted a proposalthat would prevent retail forex brokers from offering customers more than 1.5:1 leverage. While it’s possible that “The FINRA proposal sadly appeals to the lowest common denominator: the people who over-leverage positions with inappropriate stop-losses,” it nonetheless serves as a testament both to the danger of excessive leverage and to the importance of adequate risk management.
Is Gold a Hedge Against Inflation and Currency Weakness?
Until the Fed announced an expansion of its quantitative easing program two weeks ago, gold had begun to fade into relative obscurity. Sure, gold had risen in value from a low of $710/ounce back up to $900/ounce, but prices were still off 10% from the highs reached in 2008. Meanwhile, risk aversion had begun to decline and the stock market had begun to rise, such that pundits were talking more about stocks and less about gold.
Since the Fed’s announcement, however, gold has been thrust back into the spotlight. The same trading session that saw a record fall in the Dollar and a record rise in Treasury prices, also witnessed a 7% spike in gold futures prices. ” ‘Money is being pushed into the system and that’s creating the inflationary threats that the markets are contemplating…Commodities are a decent way to hedge against that potential threat,’ ” observed one trader.
Other analysts, however, caution that rising gold prices are a sign of the fear/crisis mentality, not inflation. “There are just not a lot of alternatives for global investors. You will see more and more investors moving into gold as a safe haven, and you will see more institutions putting money into commodities indexes.” In other words, gold is being driven by the safe-haven trade, which is evidenced by an increasing correlation with Treasury bonds. One commentator calls it a hedge against uncertainty: “The demand for gold is for gold coins, a massive flurry of bullion buying by ETF’s (and investors), and the institutions and traders buying the hell out of it. The reason is simple… pure fear.”
With the exception of the perennial gold bulls and conspiracy theorists, the short-term consensus is that due to “massive spare capacity now opening up in the global economy, soaring unemployment and a dysfunctional banking system – it would be very hard for central banks to generate a surge in inflation even if they wanted to.” This analyst further argues that the Fed is undertaking the expansionary program under the implicit assumption that it will have to siphon this money out of the financial system, if and when the economy recovers.
Of course, there is not even a consensus that gold is a good hedge against inflation. Mike Mish points out that the correlation between the US money supply and the price of gold is not very robust. When examined relative to a basket of currencies (rather than the Dollar), however, the relationship suddenly becomes much stronger. Especially when you filter out fluctuations in the value of the Dollar (which is affected by many factors unrelated to inflation), “gold is doing a reasonably good job of maintaining purchasing power parity on a worldwide basis.” This can be seen in the following chart:
Ascertaining a relationship ultimately depends on the time period of analysis, and the currency(s) in which prices are being tracked. Given also gold’s notorious volatility, it probably makes sense to use special inflation protected securities, rather than gold, as an inflation hedge.
Subscribe to:
Posts (Atom)